5.7 KiB
Performance Testing Analysis
This notebook describes the methodology for analyzing WinFsp performance.
Data Collection
Performance data is collected by running the script run-all-perf-tests.bat. This script runs a variety of performance tests against the NTFS, MEMFS and NTPTFS file systems. The tests are run a number of times (default: 3) and the results are saved in CSV files with names ntfs-N.csv, memfs-N.csv and ntptfs-N.csv (where N represents the results of test run N).
Data Loading
Data is loaded from all CSV files into a single pandas DataFrame. The resulting DataFrame has columns test, iter, ntfs, memfs, ntptfs. With multiple test runs there will be multiple time values for a test, iter, file system triple; in this case the smallest time value is entered into the DataFrame. The assumption is that even in a seemingly idle system there is some activity that affects the results; the smallest value is the preferred one to use because it reflects the time when there is less or no other system activity.
The resulting DataFrame will contain data similar to the following:
| test | iter | ntfs | memfs | ntptfs |
|---|---|---|---|---|
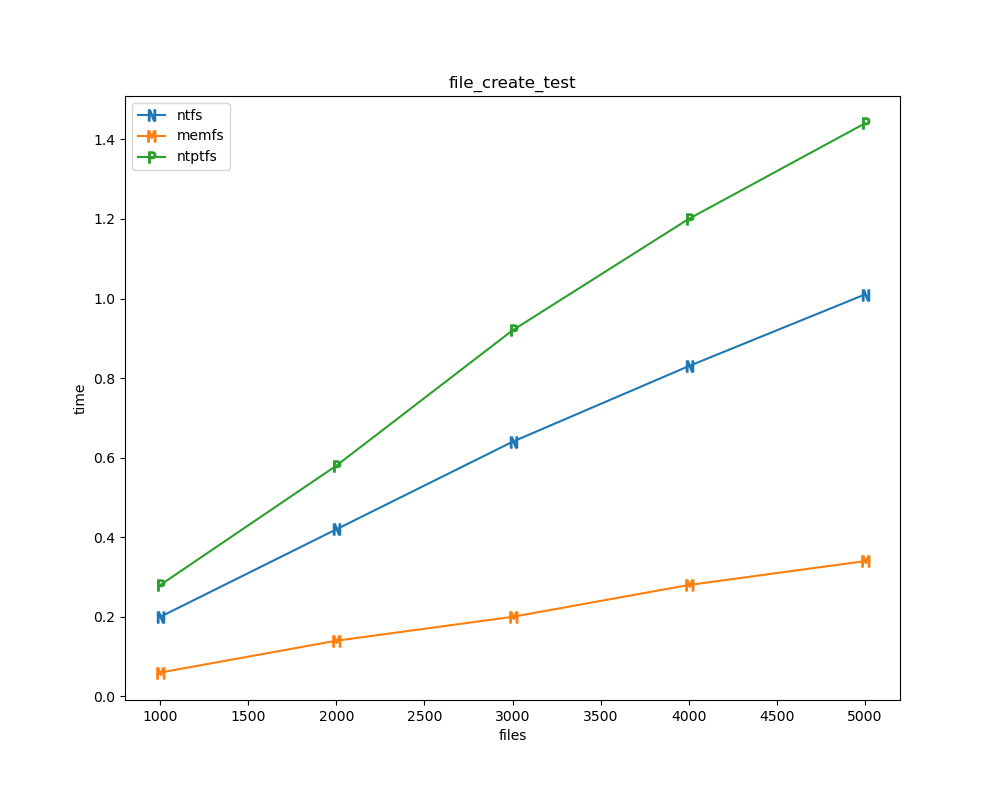
| file_create_test | 1000 | 0.20 | 0.06 | 0.28 |
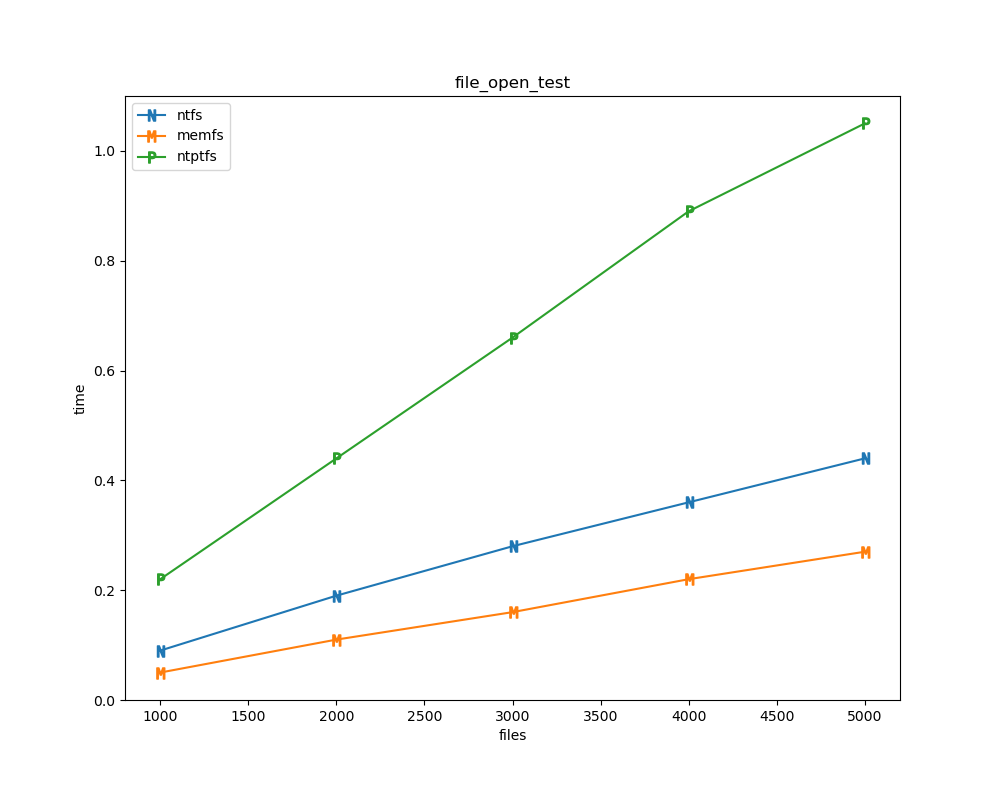
| file_open_test | 1000 | 0.09 | 0.05 | 0.22 |
| ... | ... | ... | ... | ... |
import glob, os
import matplotlib.pyplot as plt
import numpy as np
import pandas as pd

nameord = ["ntfs", "memfs", "ntptfs"]

datamap = {}
for f in sorted(glob.iglob("*.csv")):
    datamap.setdefault(f.rsplit("-", maxsplit=1)[0], []).append(f)

df = None
for n in nameord:
    ndf = None
    for f in datamap[n]:
        df0 = pd.read_csv(f, header=None, names=["test", "iter", n])
        if ndf is None:
            ndf = df0
        else:
            ndf = ndf.combine(df0, np.minimum)
    if df is None:
        df = ndf
    else:
        df = df.merge(ndf, how="left")
#df
Data Analysis
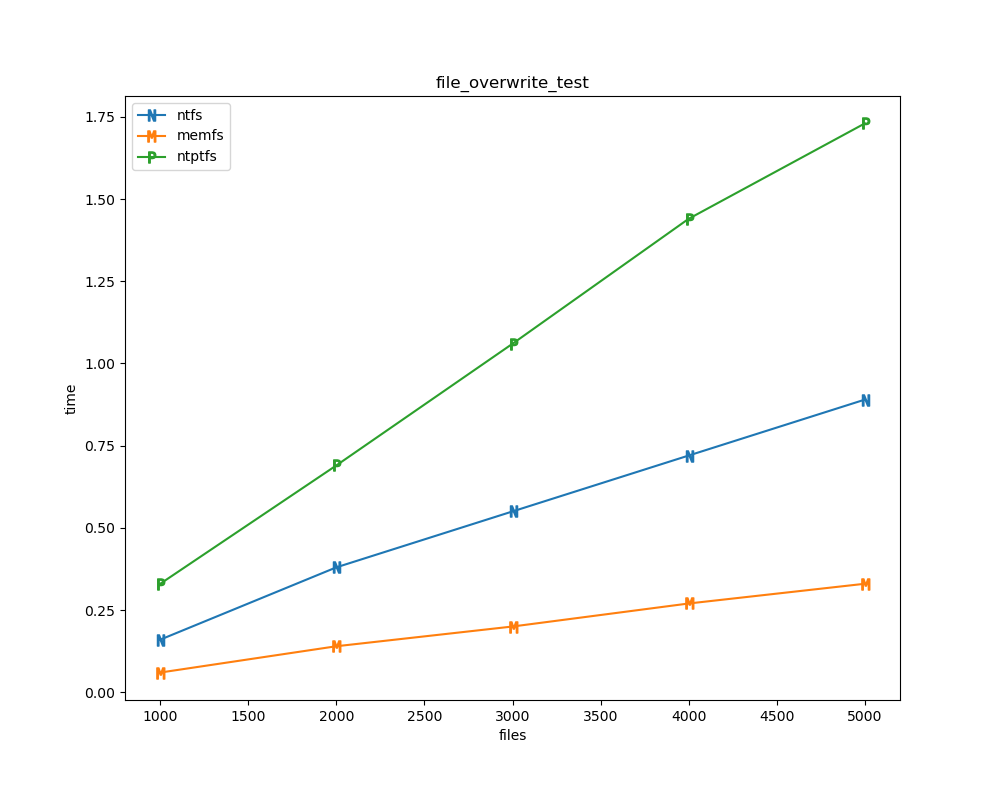
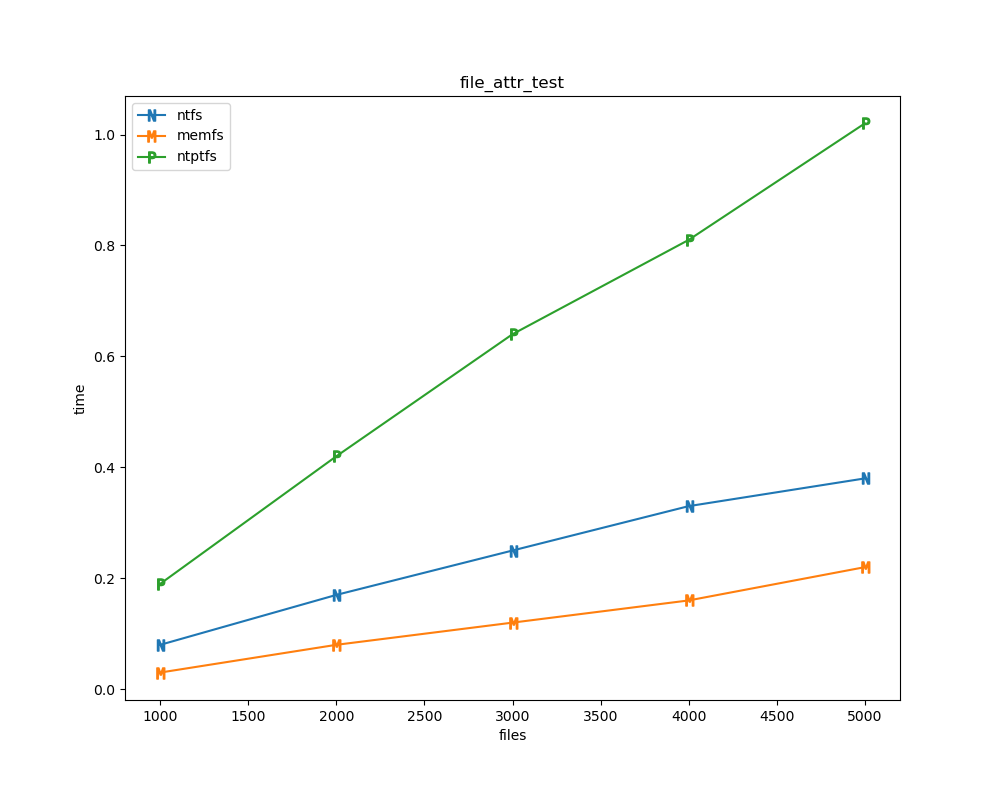
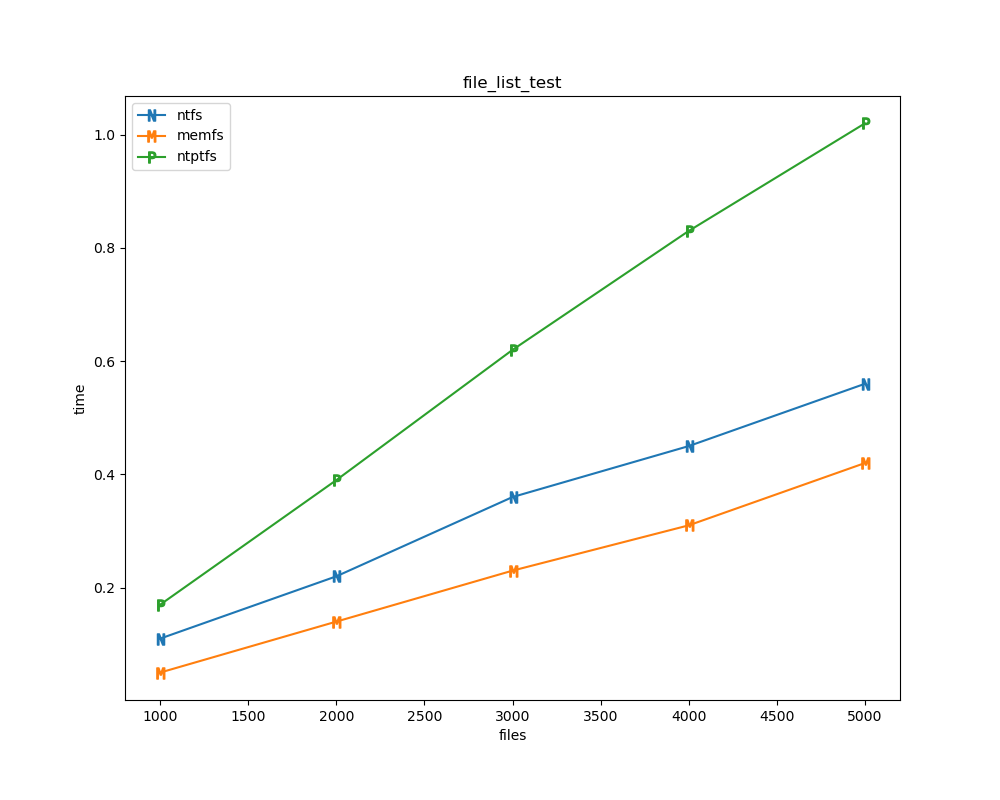
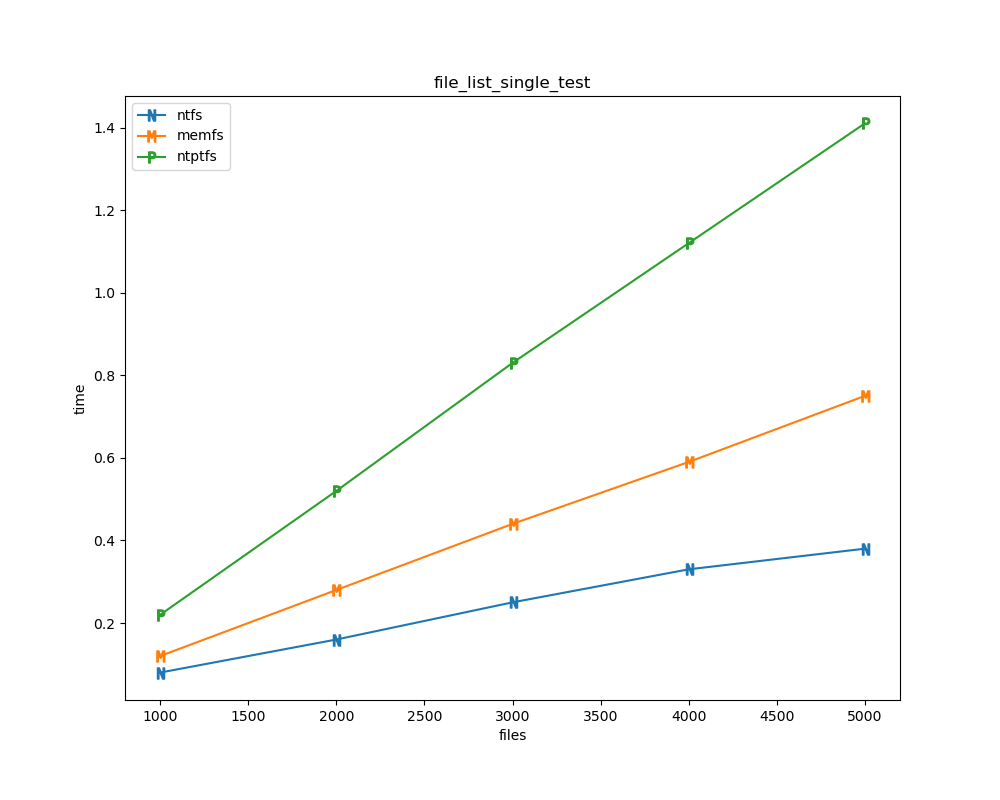
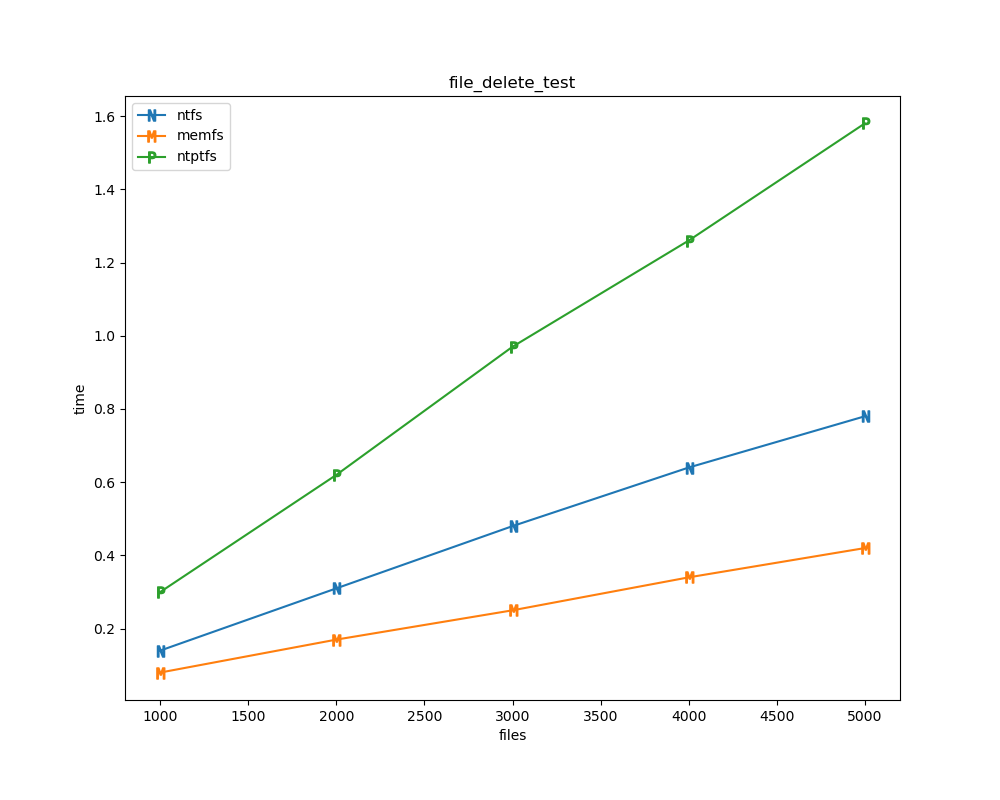
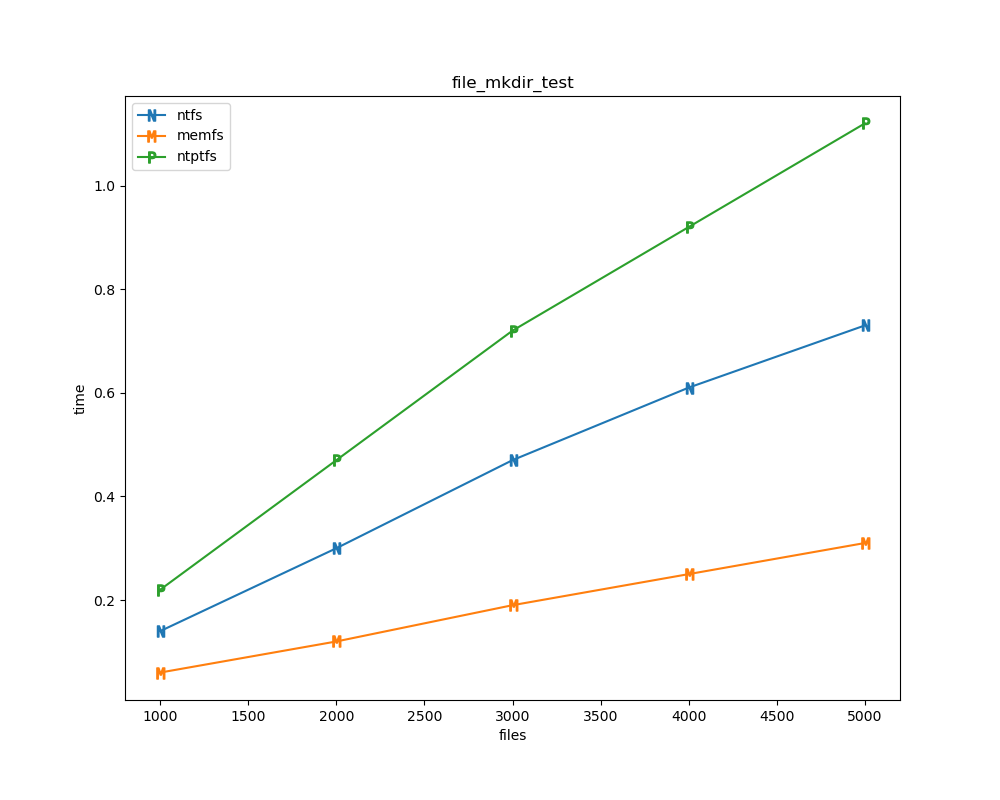
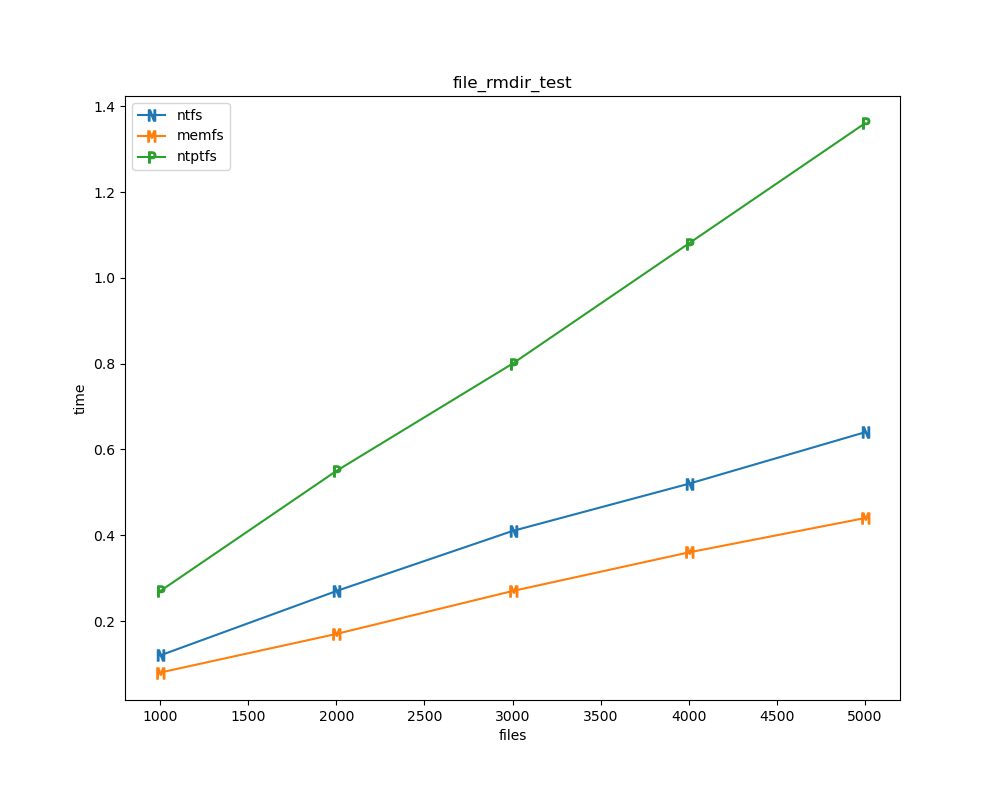
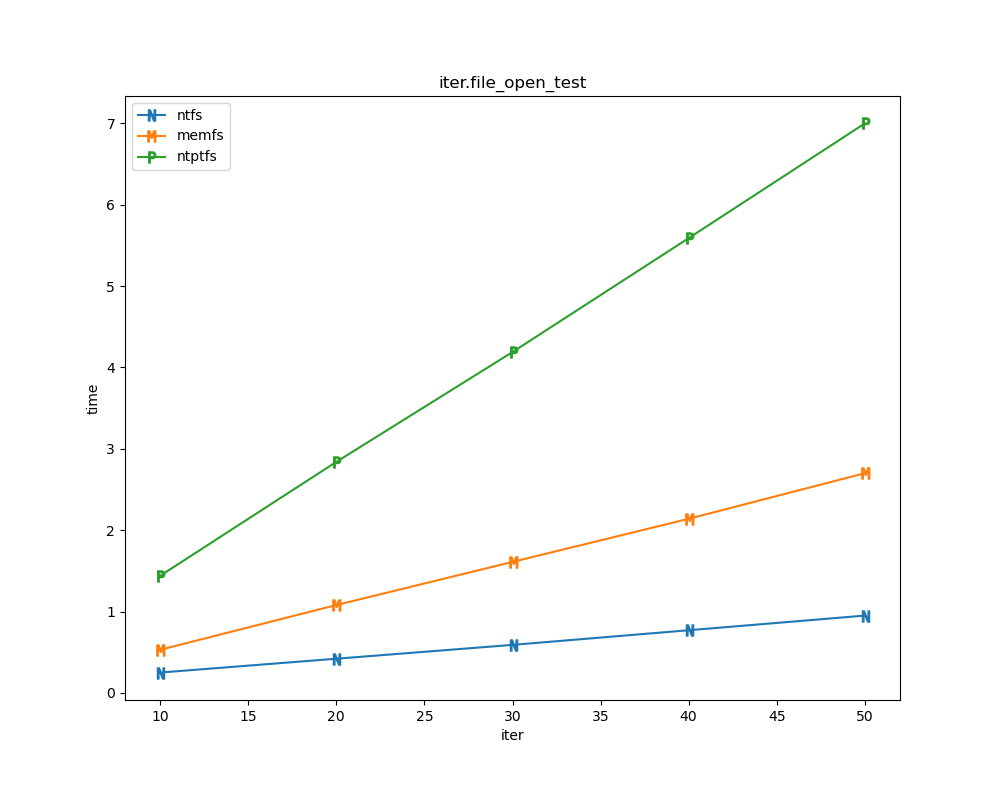
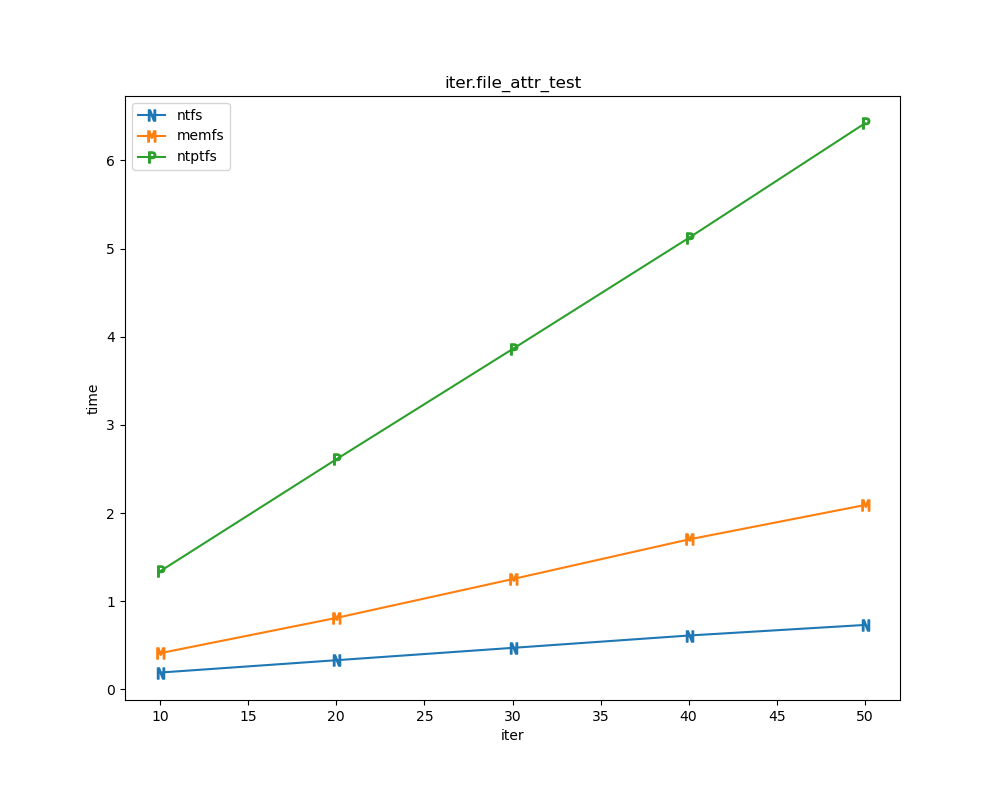
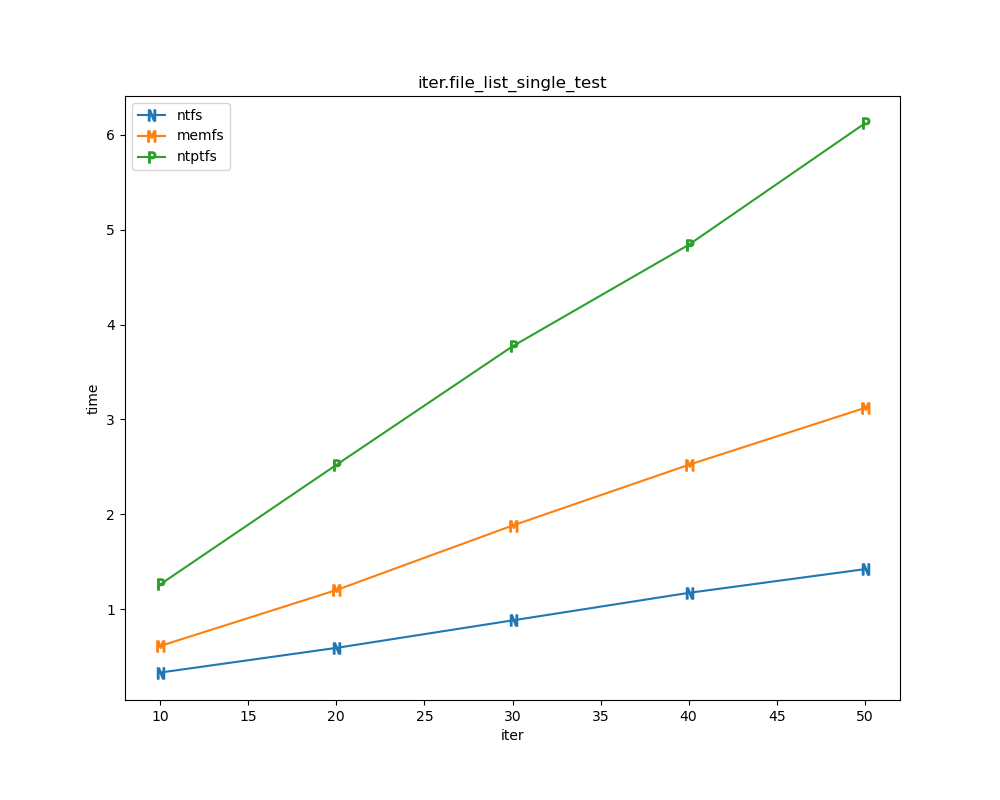
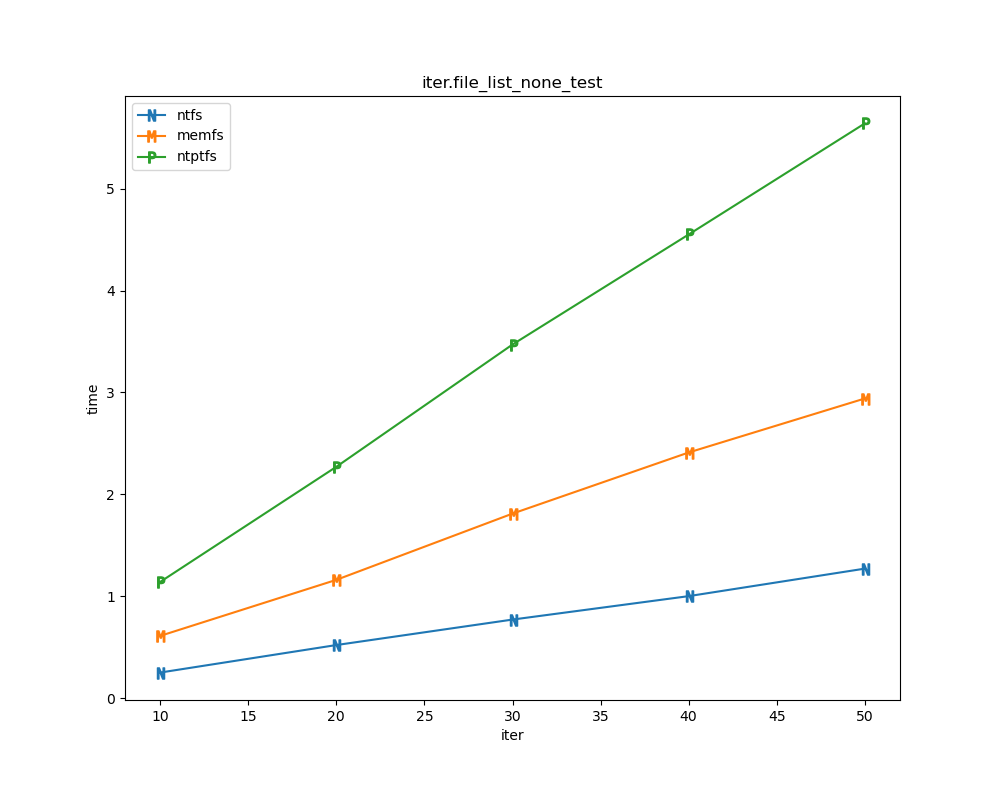
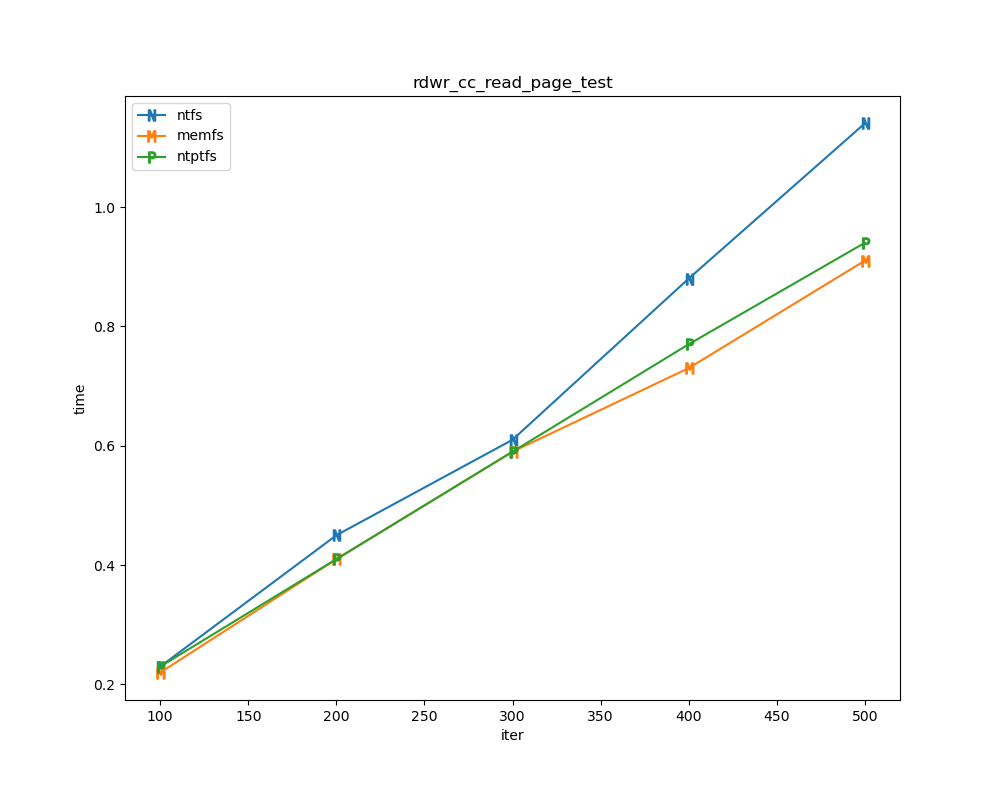
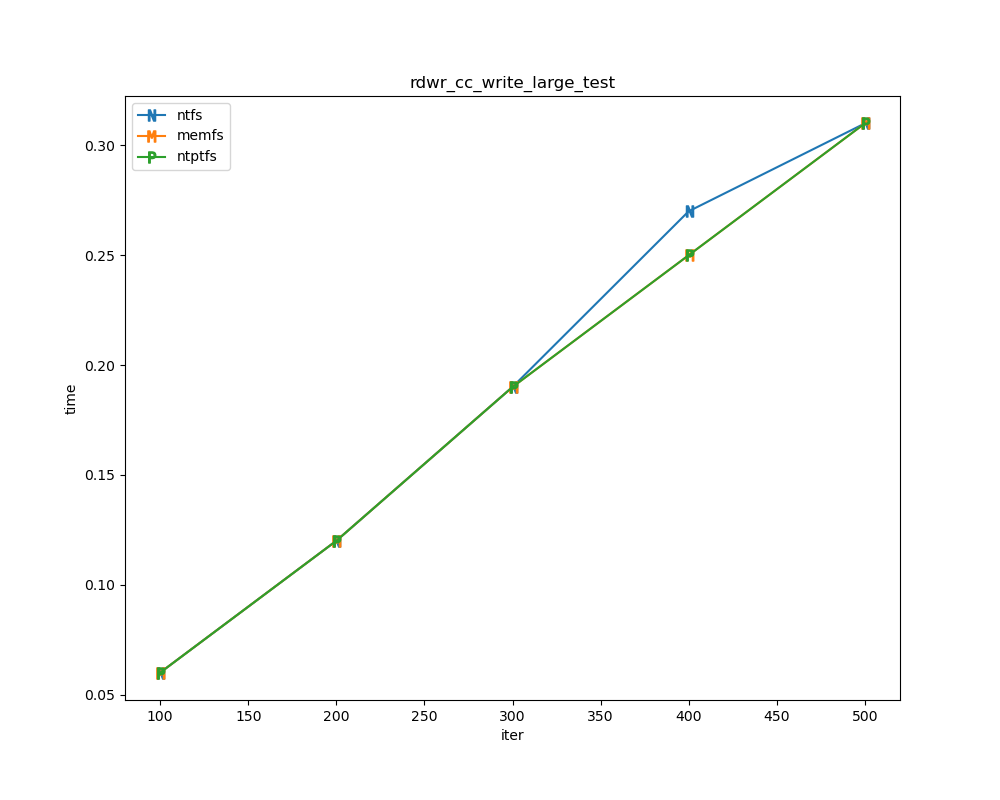
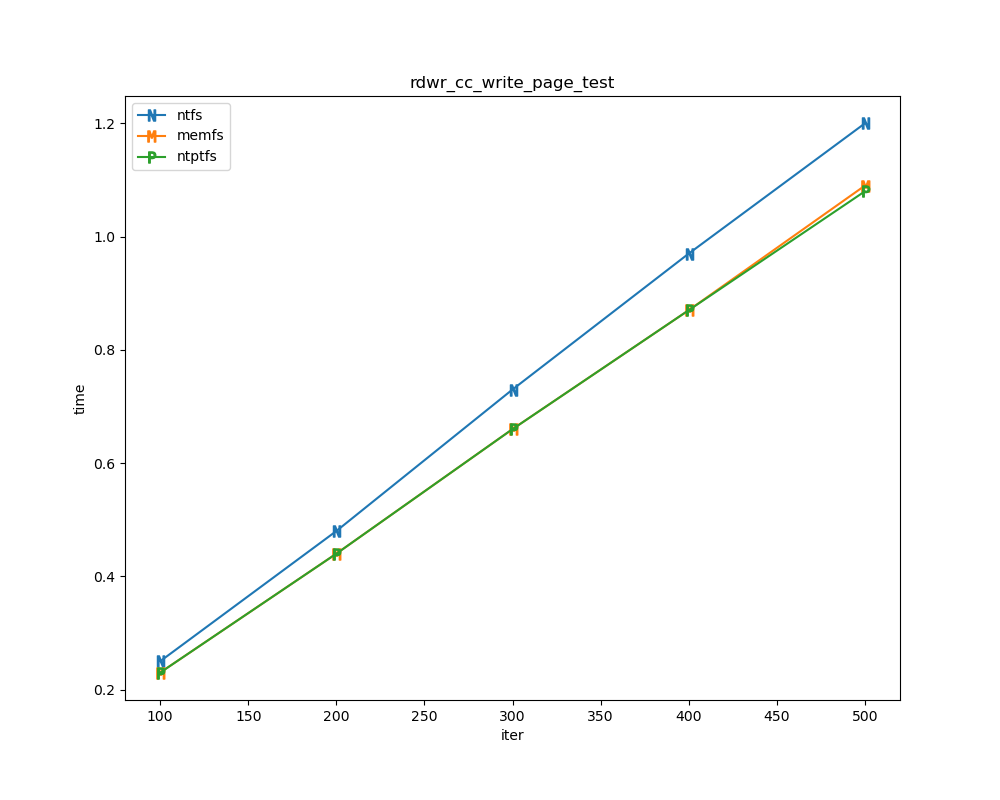
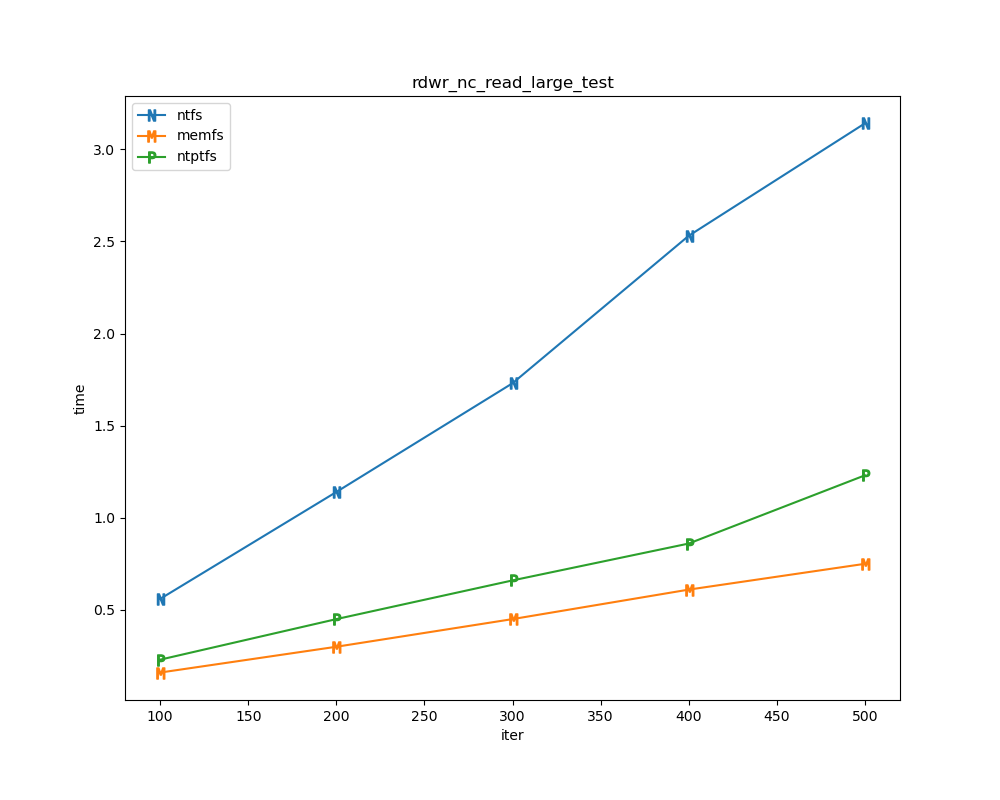
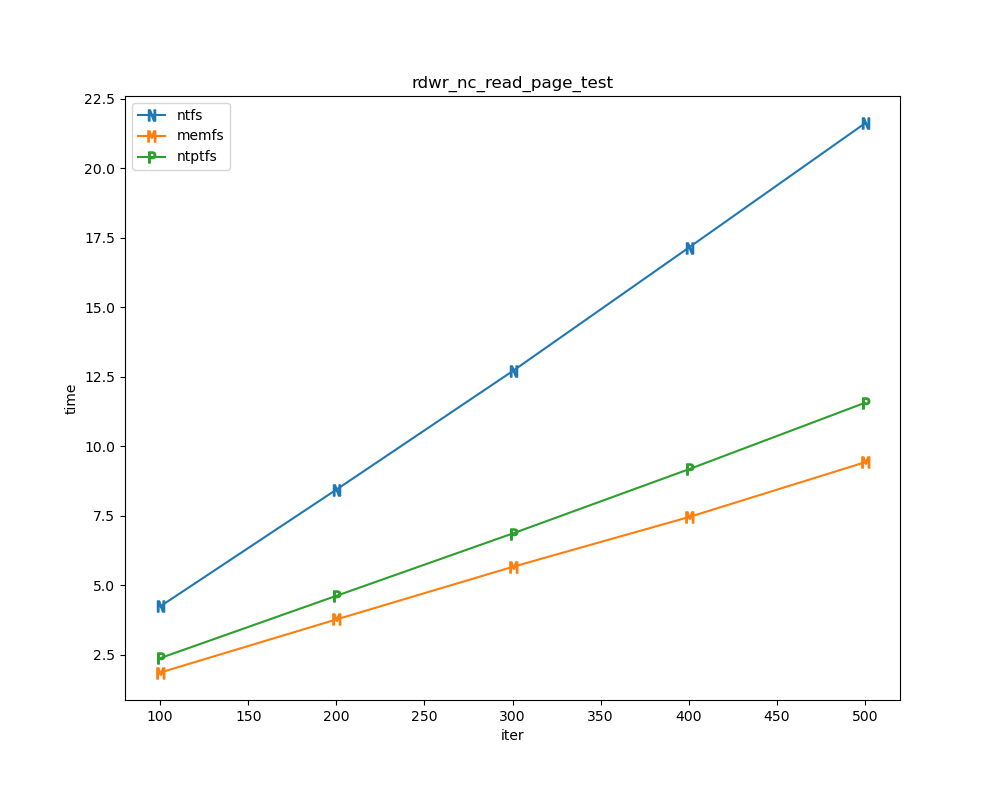
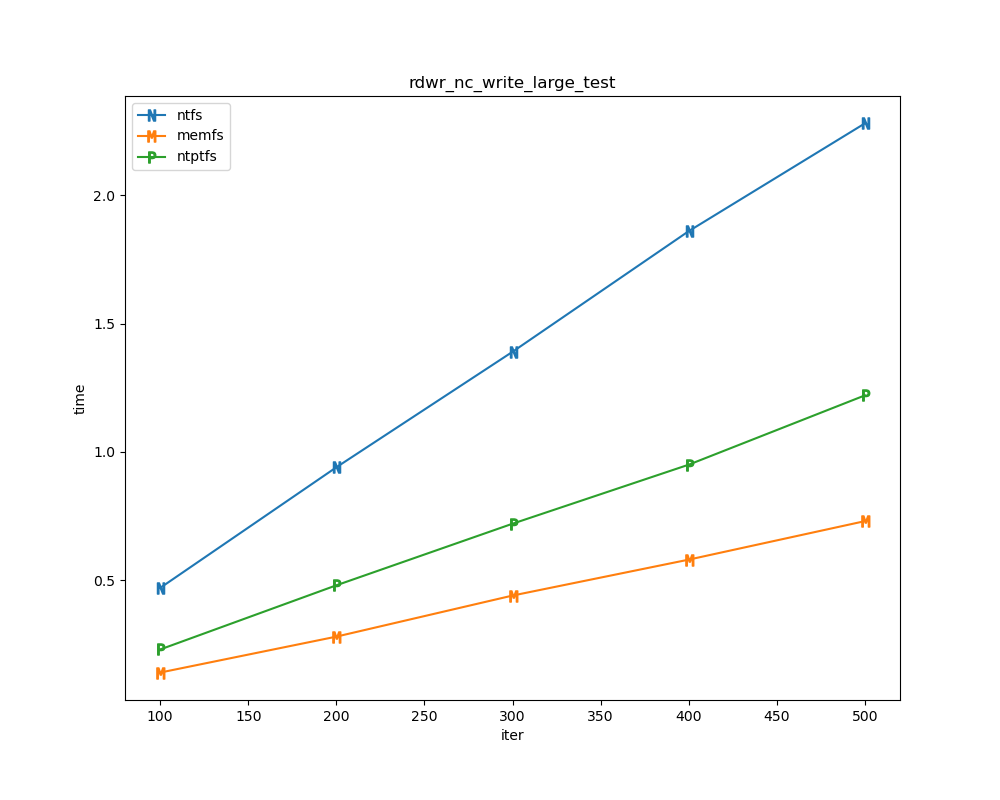
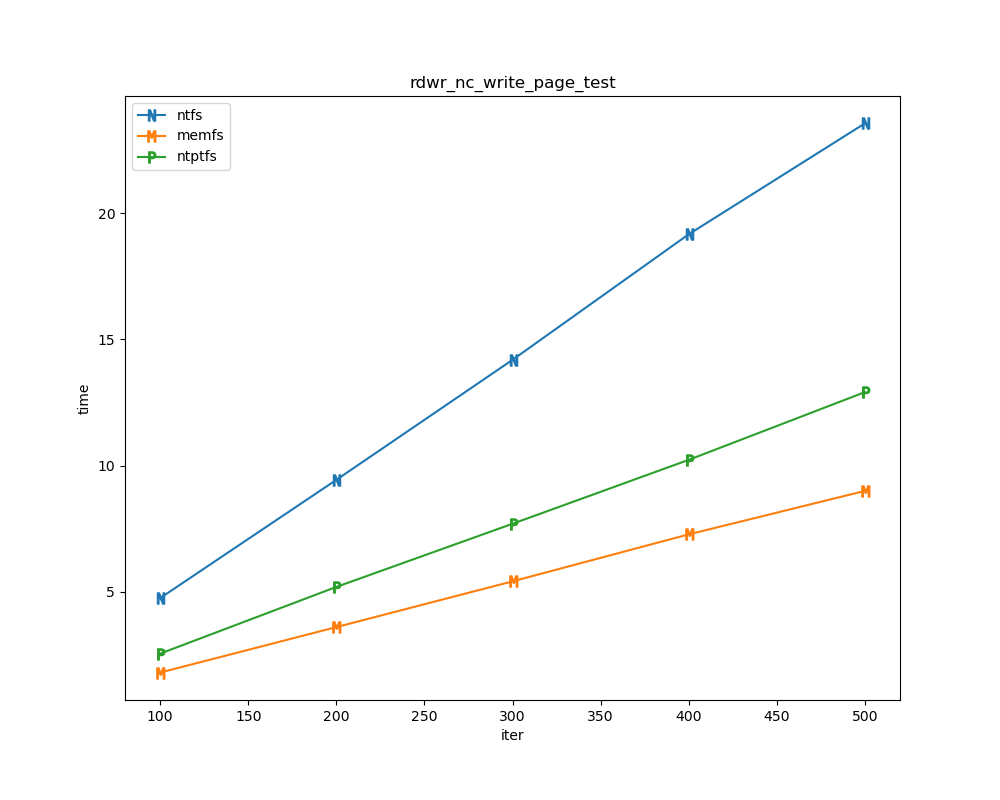
For each test a plot is drawn that shows how each file system performs in the particular test. This allows for easy comparisons between file systems for a particular test.
markermap = { "ntfs": "$\mathtt{N}$", "memfs": "$\mathtt{M}$", "ntptfs": "$\mathtt{P}$"}
for t, tdf in df.groupby("test", sort=False):
    plt.figure(figsize=(10,8), dpi=100, facecolor="white")
    plt.title(t)
    xlabel = "iter"
    if t.startswith("file_"):
        xlabel = "files"
    for n in nameord:
        tdf.plot(ax=plt.gca(), x="iter", xlabel=xlabel, y=n, ylabel="time", marker=markermap[n], ms=8)
    plt.legend(nameord)
    plt.savefig(t + ".png")
    #plt.show()
    plt.close()
File tests
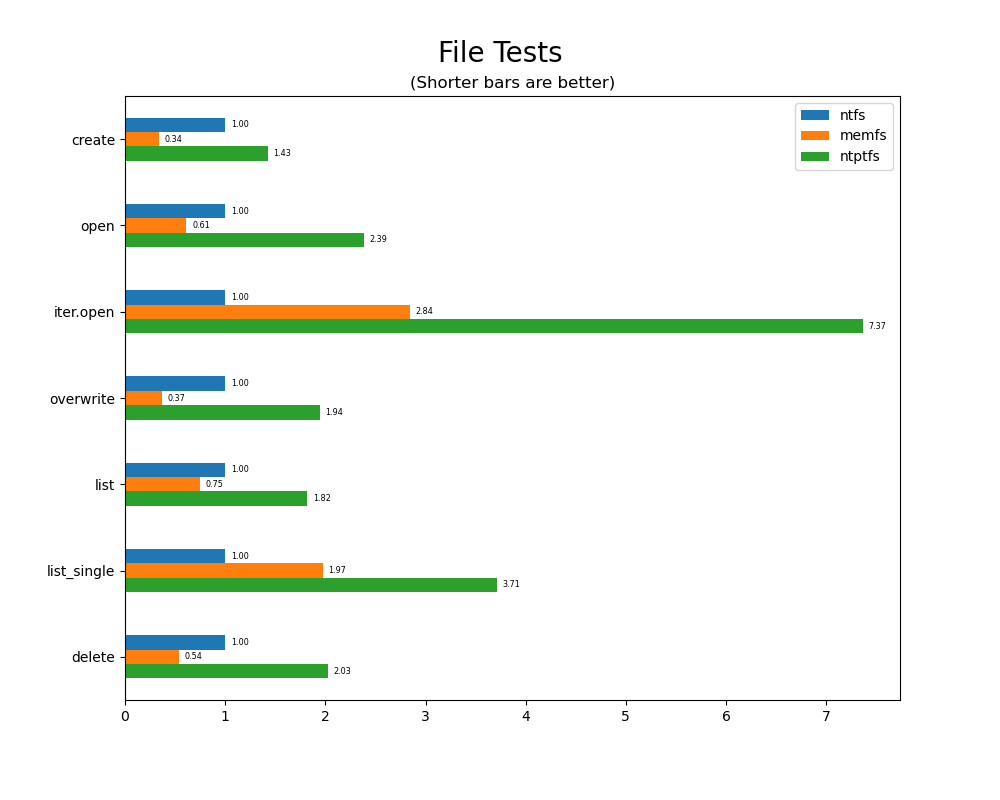
File tests are tests that are performed against the hierarchical path namespace of a file system. Such tests include file_create_test, file_open_test, etc. Measured times for these tests are normalized against the ntfs time (so that the ntfs time value becomes 1) and a single aggregate plot is produced.
This allows for easy comparison between file systems across all file tests.
fileord = ["create", "open", "iter.open", "overwrite", "list", "list_single", "delete"]
fdf = pd.concat([df[df.iter == 5000], df[df.iter == 50]])
fdf.test = fdf.test.map(lambda x: x.replace("file_", "").replace("_test", ""))
fdf = fdf.set_index("test").loc[fileord]
fdf.memfs /= fdf.ntfs; fdf.ntptfs /= fdf.ntfs; fdf.ntfs = 1
plt.figure(figsize=(10,8), dpi=100, facecolor="white")
plt.suptitle("File Tests", fontweight="light", fontsize=20, y=0.95)
plt.title("(Shorter bars are better)")
fdf.plot.barh(ax=plt.gca(), y=nameord).invert_yaxis()
plt.gca().set(ylabel=None)
for container in plt.gca().containers:
    plt.gca().bar_label(container, fmt="%0.2f", padding=4.0, fontsize="xx-small")
plt.savefig("file_tests.png")
#plt.show()
plt.close()
Read/write tests
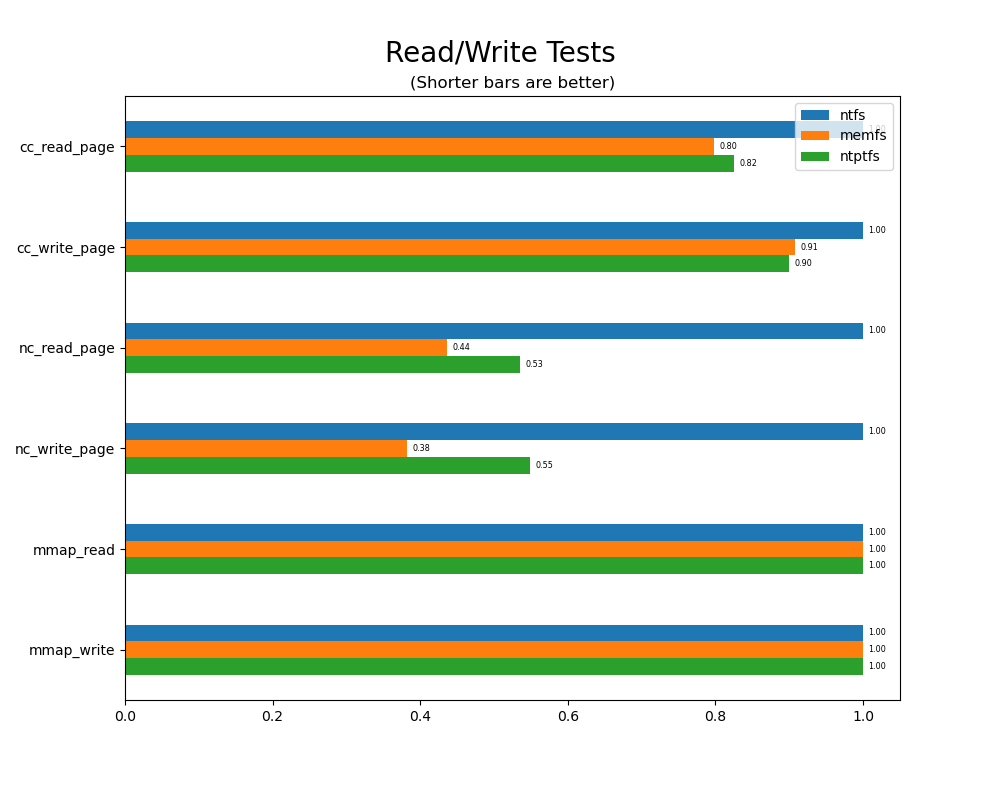
Read/write tests are file I/O tests. Such tests include rdwr_cc_write_page_test, rdwr_cc_read_page_test, etc. As before measured times for these tests are normalized against the ntfs time (so that the ntfs time value becomes 1) and a single aggregate plot is produced.
This allows for easy comparison between file systems across all read/write tests.
rdwrord = ["cc_read_page", "cc_write_page", "nc_read_page", "nc_write_page", "mmap_read", "mmap_write"]
sdf = df[df.iter == 500].copy()
sdf.test = sdf.test.map(lambda x: x.replace("rdwr_", "").replace("_test", ""))
sdf = sdf.set_index("test").loc[rdwrord]
sdf.memfs /= sdf.ntfs; sdf.ntptfs /= sdf.ntfs; sdf.ntfs = 1
plt.figure(figsize=(10,8), dpi=100, facecolor="white")
plt.suptitle("Read/Write Tests", fontweight="light", fontsize=20, y=0.95)
plt.title("(Shorter bars are better)")
sdf.plot.barh(ax=plt.gca(), y=nameord).invert_yaxis()
plt.gca().set(ylabel=None)
for container in plt.gca().containers:
    plt.gca().bar_label(container, fmt="%0.2f", padding=4.0, fontsize="xx-small")
plt.savefig("rdwr_tests.png")
#plt.show()
plt.close()
